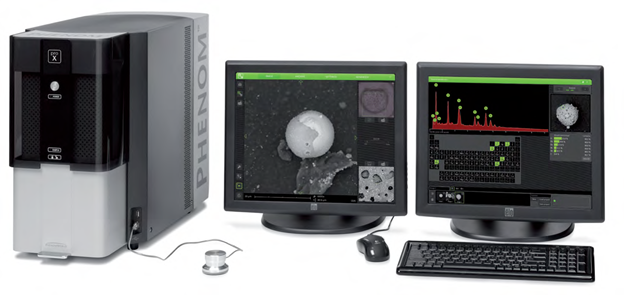
Micro-Movements of Implant-Abutment-Interface (BIO3 Implants -Implant Progressive 0 4,2)
J.W. Goethe-University Frankfurt, Address: Theodor-Stern-kai 7, Haus 2960596 Frankfurt a. Main
1 MATERIAL AND METHOD
In order to examine the existence of a microgap on dental implants; a special experimental test field was developed. For each type of implant-system tested; five inspection pieces were manufactured. Each inspection piece simulates an implant- supported molar crown in the upper jaw. During the load, in a two-dimensional chewing simulator, a constant and diverging X-ray device radiated the inspection pieces. By transformation of the x-ray into visible light; x-ray videos were recorded, using a high speed digital camera. The results will give information on the development and a conclusion of a microgap at the implant abutment interface.
2 EXPERIMENTAL SETUP
Illustration 1 shows schematically the experimental setup. Those in the x-ray source: [1] analysation of an exemplary inspection piece loaded in a two-dimensional chewing simulator [3] [2; 4]. The x-rays are converted in the image amplifier [5] into visible light. The quantity of light coming from the image amplifier meets the CCD sensor of the High speed digital camera [6]. Afterwards; the camera sends a digital signal to an attached computer, whereas the computer then develops x-ray-videos on the processes of the Implant-Abutment-Interface.
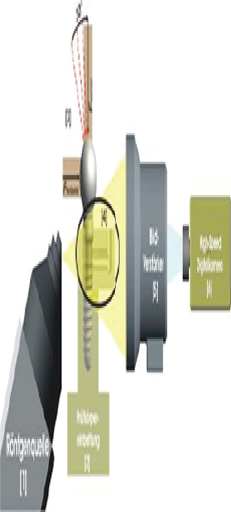
Fig. 1: Schematic representation of the experimental setup.

2.1 Source of x-ray
In the, here described, investigation an x-ray unit type FXS-160.50 was used. (Fine focus of X-Ray systems, www.yxlon.de). Fig. 2 shows a schematic diagram of the x-ray unit used.
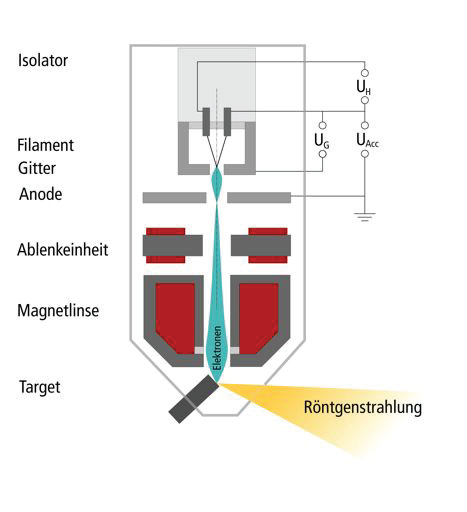
Fig. 2: Schematic structure of the x-ray tube.
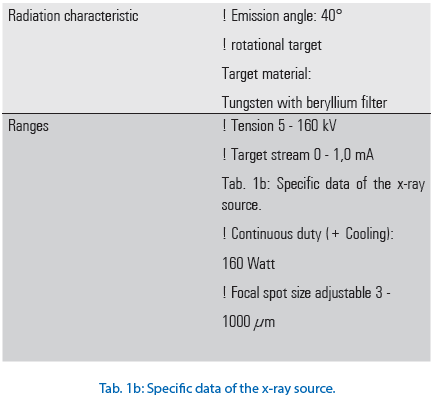
Used specific data for the source of x-ray are the Tab. to infer 1a and b.
2.2 Inspection piece

THE IMPLANT BODY EMBEDDING
The result of the preparation measures is a system-specific embedding process, for an enossal implant with a definitely attached abutment. On this prosthetic post the cementing cap is fastened and the load attachment is screw-fixed in such a way that the measurements requirements are fulfilled; as shown in fig. 12 b. In fig. 13 finally prepared implant is to be shown.
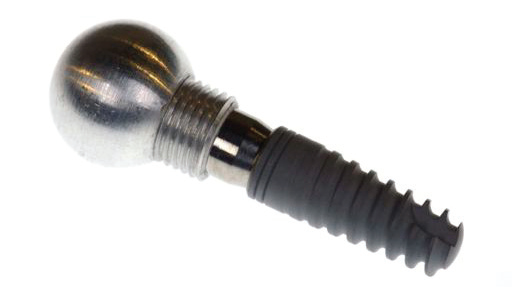
Fig. 13: Bio3 Implants – Progressive Implant with cemented cap and load attachment (ball).
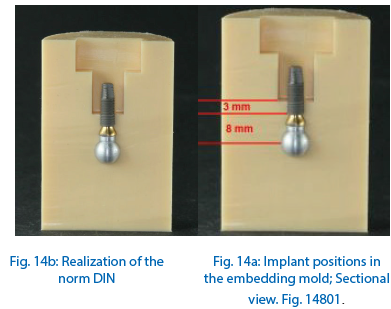
With the help of the manufactured molds the implants could be embedded, using the transparent, 2-component material on basis of Methylmethacrylat, in form of powder and liquid (Technovit® 4004; www. kulzer technik.de). The screwed ball cap (load attachment) ensures an accurate positioning of the implant in the embedding mold (fig.14a and b).
After positioning of the implant in the embedding mold, the cavity (T-fitting) was filled with resin (Technovit® 4004; www.kulzer-technik.de). Fig. 15 shows an implant in the embedding mold and Fig. 16 shows the filling of the cavity with resin.
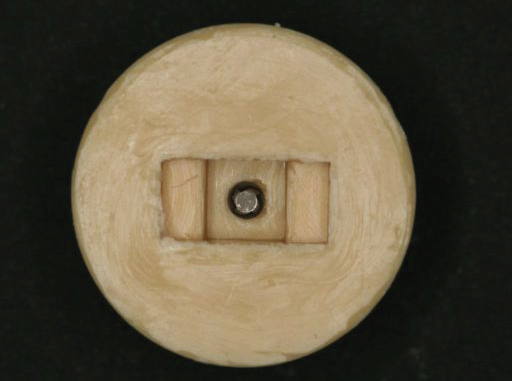
Fig. 15: Implant in the embedding mold; View on the apical portion of the implant.
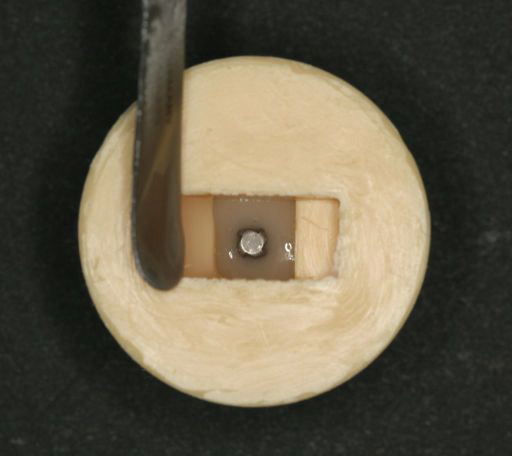
Fig. 16: Filling of the embedding mold with resin.
After the polymerization (manufacturer data 4-6 min.) the implant was firmly embedded in the resin and could be removed from the form. Fig. 17 represents an implant after removal from the mold. The load distance, defined by the distance from the ball center up to the implant shoulder, is a consistant 8mm (tolerance +/− 0,1mm). The height of the embedded implant body corresponds to the portion of the implant, which is clinically embodied in the bone. Following the DIN EN ISO 14801 a boneloss was of 3mm was simulated.

Fig. 17: Directly after releasment from mold. Embedded implant with load attachment (ball cap). DIN 14801 illustration.
This embedding-material was selected because its’ module of elasticity (elastic module) of approximately 2000 - 2300 N/mm2 (Technovit® 4004, www.kulzer-technik.de) and is therefore a little over the value of Human Spongiosa. Human bone values are known to be between 1000 N/mm2 (Spongiosa) and 10000 N/mm2 (Cortical). In the herein examined study an implant-supported molecular crown of the upper jaw was simulated. The maxilla consists in large of Spongiosa; whereas the Corticalis, with its’ compact structure, constitutes only a small portion. Therefore the Corticalis under clinical conditions surrounds a smaller part of the implant body than the Spongiosa. Elastic module of the herein used embedding-material was selected so that it resembles the elastic module of the Spongiosa. The influence factor of the Corticalis was thereby considered.
2.4 Chewing simulator
In the available investigation a two-dimensional chewing simulator was used. „The Frankfurt chewing simulator “was designed and built particularly for testing of Implant Abutment connections (IAI). It makes the application of two-dimensional chewing forces possible. On the inspection samples and/or on the IAI, the influencing force is produced by two electro-dynamic force actuators. These are arranged in right-angles to one another in the „Frankfurt chewing simulator “ (Fig. 18).
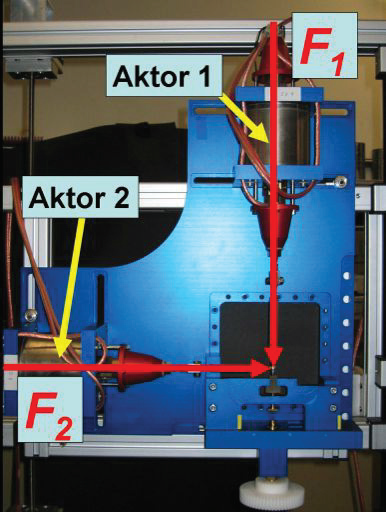
Fig. 18: Overview admission of the chewing simulator.
The force-time-process is variable and adjustable in the used actuators. Both actuators use the Lorenz strength, for which the following formula is the basis.

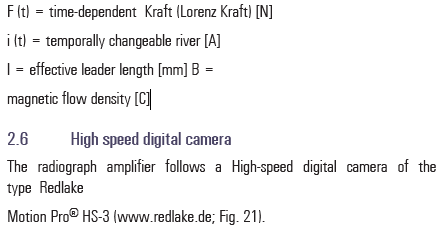
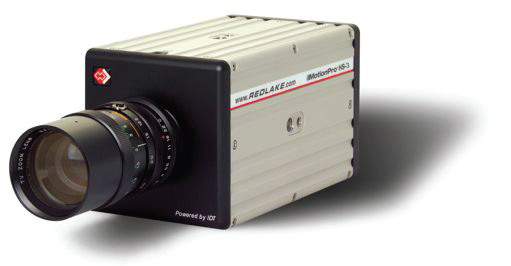
Fig. 21: High speed digital camera Redlake Motion Pro® HS-3.
This type of camera offers an integrated CCD sensor (load Couplet DEVICE sensor). A CCD sensor sends a digital signal proportional to the irradiated quantity of light. The camera is connected by an USB interface to a computer. The digital camera used here can achieve 1000 pictures per second. The arriving signals were “rushed“. By averaging each individual pixel, of several one behind the other noted pictures, the signal noise could be reduced. The number of pictures, which are charged with one another, is limited by the arising in-motion unsharpness. The highest image quality was reached with the mean calculation of 11 successive pictures. The calculation of the pictures took place via a developed computer program in LabVIEW® (www.ni.com). Fig. 22 represents an exemplarily calculation of 11 pictures, fig. 23 to a and b in each case a non-calculated and a calculated picture.

Fig. 22: calculation of picture.

Fig. 23a : Not calculated picture (raw data).
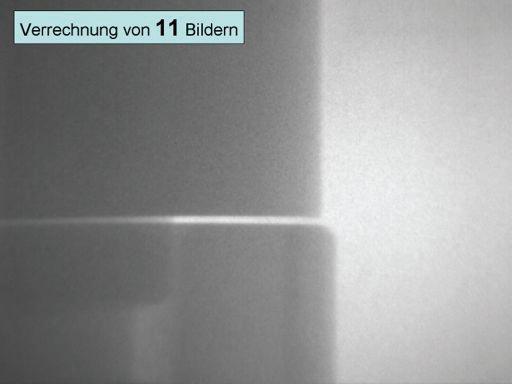
Fig. 23b: Picture after calculation of 11 pictures.
The high image frequency makes for the production of videos, alongside the recording of frames also, possible. The controll of the camera is guaranteed with the help of the graphic programming system LabVIEW® (www.ni.com). The clock frequency, the exposure time and the number of pictures can be adjusted reproducibly. The actuators of the chewing simulator were likewise controlled through and by LabVIEW®, wherein a synchronization of the actuators and the camera took place.
2.7 Load arrangement
All inspection pieces were loaded with forces by 25N, 50N, 75N, 100N, 125N, 150N, 175N, 200N. The axial force vector (Faxial) was increased up to the, before defined, force. The inclination of the resulting force vector (Fresultant) from 30° to the implant axis took place via a force application of the horizontal force vector (Fhorizontal), represented in fig.24.
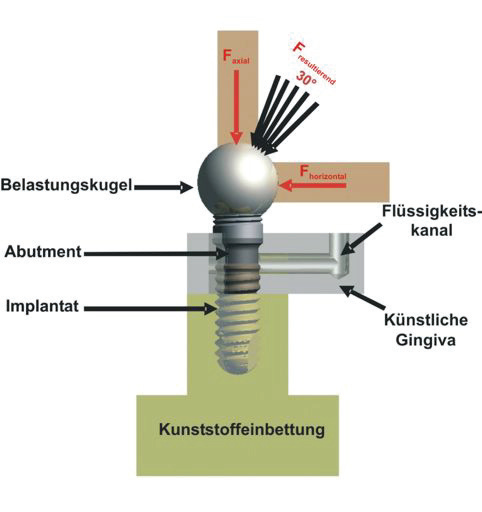
Fig. 24: Schematic representation of the load arrangement.
2.8 Evaluation
The high image frequency makes it possible to provide x-ray videos. For this; every tenth picture was used. The rate of change in the chewing simulator and the produced force, reaching up to the total force amounts of 0.3 N/ms, whereas the rate of change amounts to
0.6 N/ms, to reach the zero point. The period of time that the axial actuator takes to reach the total force amount was equal to the period during the inclination of the force. From this; results the total time of an inspection piece per force cycle. The load cycle determines the recording time of the camera. Synchronization between the actuators and the camera over LabVIEW® under Microsoft Windows XP is not accurate and therefore it was necessary to include an added and an overhanging time for each cycle period. Preliminary tests resulted in an added time of 100 pictures and an overhang time of 1000 pictures. For example a load of 200N results in a load period of 1.66 seconds. The frequency of 1000 pictures, per second, leads to the admission of altogether 2766 pictures. For the production of the x-ray video as "avi.file" with LabVIEW® (www.ni.com) 276 pictures are used after calculations. The x-ray video corresponds to quadruple the slow motion and makes the evaluation of the dynamic processes at the Implant-Abutment-Interface possible. The existence of a possible microgap could be examined by the behaviour of the implant components in the x-ray device. The evaluation of all provided radiographs and x-ray videos were made visually. The visual evaluation of the frames and the provided x-ray videos were evaluated for an existing micro gap between the implant and abutment. Existing cyclic openings and closings of the micro gap could be made visible. In order to measure the developed gap the frame, during and at its’ maximum load, was determined. In this frame each pixel inside the gap was counted. According to the resolution of the x-ray video one pixel corresponds to 1,8µm. Therefore the exact size of an existing gap was specified.
3 RESULTS
The results of the here-described study are represented in the following charts. According to the investigational procedure, the occurrence of a micro gap between the implant and the Abutment is shown.
Tab. 3 shows the results of the micro-gap [µm]. For all 5-inspection pieces the starting picture with no load on it and the picture of the 200N load-cycle is shown.


4 EVALUATION OF THE RESULTS
The Implant Progressive (∅ 4,2mm x 11,5mm) manufactured by Bio3 Implants, which were loaded with a maximum force of 200N and then analyzed under x- ray, showed no detectable micro-gap.
Comparably one can conclude that, to date and without exception, other classical butt type connections with a horizontal contact surface between the implant and abutment, and under the same conditions, show a micro-gap as well as a micro- pump effect.
Disclaimer from Guident
The views and opinions expressed in articles published in Guident are solely those of the authors and do not necessarily reflect the views of the editors, the editorial board or the publisher, Ivory India. Guident does not endorse any product, technique or treatment described. Clinical content is intended for qualified dental and medical professionals and is not a substitute for individual clinical judgement. Guident, its editors and the publisher accept no liability for any consequence arising from the use of information published in the journal.
How to cite this article
Dr. H.CH.Lauer Department of Prosthodontics Dentistry. Micro-Movements of Implant-Abutment-Interface (BIO3 Implants -Implant Progressive 0 4,2). Guident. 2015 Jun;8(7). Available from: https://guident.in/articles/research/micro-movements-of-implant-abutment-interface-bio3-implants-implant-progressive-0-4-2.html