Evaluation of Color Stability of Flexible Denture Base Resin in Four Commonly Used Food Solutions
Sri Ramakrishna Dental College Hospital, (Dr MGR Medical University ), Coimbatore, TN, India
Abstract
Objective
The objective of this study was to evaluate the color stability of flexible denture base resin in four commonly used food colorants in India.
Methods
Valplast material was processed in two thicknesses [1-1.5 mm] and [2-2.5 mm] using injection moulding technique. They were immersed in tea, coffee, turmeric and sunset yellow for a period of one hour /day for 10 days, 30 days and 60 days (Group X, Group Y and Group Z respectively). The colour stability was analysed with a spectrophotometer.
Results
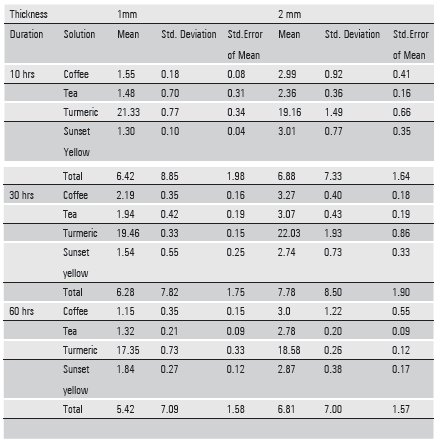
The ∆ E values of Group Z were lower than that of Groups X and Group Y.The turmeric solution produced greater colour change than the other solutions(∆ E>3.7).The 1-1.5 mm samples of Group X, Group Y and Group Z in all the subgroups were more color stable than the 2-2.5 mm samples except the turmeric subgroup, in which both 1-1.5 mm and 2-2.5 mm samples exceeded the noticeable range.
Significance
Within the limitations of this study it was concluded that the thickness of the sample, the solution used, duration of immersion of the samples, and their interactions were significant in producing colour change of valplast material.
Key words: Color stability, partial edentulism, flexible denture base resin, polyamide resins, thermoplastic resins, injection moulding, turmeric, sunset yellow, spectrophotometric color analysis, CIE color lab system.
INTRODUCTION
The prevalence of partial edentulism in Indian population in the age group of 25 years and above is about 60- 69%1.Removable partial dentures fabricated with thermoplastic resins are an economic treatment option to conventional cast partial dentures for this partially edentulous situation. Thermoplastic resins possess properties like superior esthetics, reduced potential for allergic reactions, and flexibility due to high elastic nature2.
Being a more esthetic alternative to cast partial dentures their color stability has to be evaluated over clinical use.Color stability is the ability of a material to retain its colour in a specified environment, especially in long term use3. Most denture base materials are subject to sorption that results in discoloration when the contacting solution is pigmented.4 Beverages such as tea, coffee, wine and artificial food colorants like erythrosine, tartrazine and sunset yellow increase the development of stain on clean denture base surfaces.
Tea and coffee contain large amount of staining agents like gallic acid and tannins.Turmeric is used in a variety of foods,it contains curcumin(3%) which is an active staining agent.Thermoplastic resins are increasingly used in recent years, but there are only few studies reported on the color stability of flexible denture base resins. The objective of this study was to evaluate the color stability of flexible denture base resin of two thicknesses (1.0 –1.5 mm) and (2.0-2.5 mm) in four commonly used food substances when exposed to different durations with the hypotheses that the thickness of the material, duration of exposure and the type of food substance does not affect the color stability.
MATERIALS AND METHODS
In this study, color stability of valplast material (Valplast International Corporation, New York, USA) was tested in two thicknesses [20x10 x(1-1.5 mm)] and [20x10x (2-2.5 mm)]in three time durations (10 hrs, 30 hrs and 60 hrs).An aluminum metal mould was made for making wax patterns. The mould was made in two parts – lid and base (Fig a). The base part contained 4 rectangular cavities, two cavities of 20x10mm dimension and 1-1.5 mm depth and two cavities of 20x10mm dimensions and 2-2.5 mm depth. On locking, the base and the lid formed a channel through which molten wax (Modelling wax, Hindustan Dental Products, Hyderabad, India) was poured to make the wax patterns.
The samples were processed by injection moulding technique.A flask designed by the manufacturer (Valplast International Corp, New York, USA) was used. Wax patterns were invested in the lower part of the dental flask and space maintainer for the cartridge was placed. The counter part of the flask was placed on the base part and the dental stone was poured. After the stone had set, the flask was dewaxed and the space maintainer removed. Separating medium was applied and the flask was allowed to cool to the room temperature.
The valplast cartridge (Valplast International Corp, New York, USA) was placed in the furnace and preheated to a temperature of 287.70 â°C (550â° F) for 11 minutes. The stone moulds were exposed under heat lamps and was uniformly heated for 15 to 20 minutes to a temperature of 80°C to avoid any premature freezing of the molten nylon as it entered the mould cavity under pressure. The metal injector was placed in position and along with the cartridge containing molten Valplast, they were placed on to the injection unit. The molten Valplast was then forced into flask using a plunger, the injection moulding pressure being maintained at5 bars for 3 min and then the assembly was removed and disengaged.
The flask was bench-cooled for 20 min and then deflasked. The blanks were removed from the moulds and the sprues were removed with a Valplast specific cutting disc (Valplast International Corp, New York, USA). The surfaces of the specimens were polished using Valplast specific polishing compounds (Valplast International Corp, New York, USA) according to the manufacturer’s instructions.
A total of 130 samplesi.e 65 samples with thickness 1-1.5 mm and 65 samples with thickness 2-2.5 mm were made. Of the 65 samples of 1-1.5 mm thickness, 5 samples served as the control group (Group A) and the remaining 60( experimental group) were further subdivided based on the duration of exposure to food colorants as Group X1(10 hours- 20 samples), group Y1( 30 hours – 20 samples) and Group Z1( 60 hours – 20 samples). The 20 samples in each group were further sub-grouped based on the staining solution (Coffee – 5 samples, Tea- 5 samples, Turmeric- 5 samples, Sunset yellow- 5 samples). Similar sampling pattern was followed for the other 65 samples with 2-2.5 mm thickness (Control group – Group B– 5 samples and experimental groups X2, Y2, Z2 with 20 samples each along with their subgroups.(Fig b)
The color stability was assessed in four commonly used food ingredients- Coffee, Tea, Turmeric and Sunset yellow.Coffee solution was prepared by dissolving 2 g of coffee (Bru, Hindustan Unilever Ltd, Mumbai, Maharashtra, India) in 200 ml of distilled boiling water for 2 minutes. Tea solution was prepared by dissolving 2 g of Tea (Three Roses, Brooke Bond Pvt Ltd, Kolkata, West Bengal, India) in 200 ml of distilled boiling water for 2 minutes.
Turmeric solution was prepared by dissolving 1 g of turmeric (Sakthi Pvt Ltd, Erode, Tamil Nadu, India) in 200 ml of distilled boiling water for 2 minutes. Sunset yellow solution was prepared by dissolving 0.05 g of sunset yellow dye (Venus Chemicals and flavours, Chennai, Tamil Nadu, India) in 200 ml of distilled boiling water for 2 minutes. The solutions were filtered to remove the dust. Fresh solutions were prepared once in a week.
The control group samples (Group A and Group B) were stored in distilled water in separate glass jars.(Fig c) The staining solutions prepared were allowed to cool to room temperature and stored in glass jars in dark. The solutions for the three groups - Group X, Y and Z, were stored in separate containers. The glass jars were labelled indicating the solution, duration and the thickness of the samples. Holes were made in all the 130 samples and they were suspended by means of threads in the solutions. They were immersed in the test solution for a period of one hour/day after which the specimens were removed, rinsed and stored in distilled water. The samples were stored in dark at room temperature to simulate the oral conditions.This procedure was done for 10, 30 and 60 days for Groups X, Y and Z respectively. (Fig d)
On the day of evaluation, the samples were removed from distilled water, and packed in plastic bags, labelled and taken for color analysis. The color analysis of the samples was done with ultraviolet visible recording spectrophotometer (Macbeth 7000A) using the CIE colour lab system.5,6. (Fig e)Each sample was dried thoroughly by blotting with tissue paper before analysis. It was placed in the view port of the spectrophotometer and L, a and b values of each sample were measured. Three readings were made for each sample and the average output per sample was given automatically by the spectrophotometer using the CIE colour lab system. A total of 130 readings were taken, 10 readings for the control group and 120 readings for the experimental group.
 |
| Fig a: Metal die Fig b: Grouping of the samples |
 |
| Fig C: Group A, Group B and Immersion in distilled water Fig D: Group X1, X2( Immersion - 10 hours), Group Y1,Y2 (Immersion - 30 hours), Group Z1, Z2(Immersion- 60 hours) Fig E: Macbeth 7000 A spectrophotometer and spectrophotometric color analysis Fig F: Colour change observed in Group X, Y and Z |
RESULTS
E values from spectrophotometer
The values of the control group (standard) were taken as L1, a 1 and b1 for 1-1.5 mm samples and L2, a2 and b2 for 2-2.5 mm samples. Similarly values of the experimental group(sample) was taken as L1, a1 and b1 for the 1-1.5 mm samples and L2, a2 and b2 for the 2-2.5 mm samples . The colour difference E for 1-1.5 mm sample was calculated using the formula E (1-1.5mm) = [(L1) ²+(a1)²+ (b1)²]½.The colour difference E for 2mm samples was calculated using the formula E (2-2.5mm) = (L2) ²+(a2)²+ (b2)²]½.The mean and standard deviations of the colour change (E) are presented in Table 1.
1. One Sample Kolmogorov- Smirnov test: (Table 2)
The mean and standard deviation was calculated and subjected to One-Sample Kolmogorov-Smirnov Testto find out whether the given distribution is normal or not. To test this, a null hypothesis was formed that the observed data followed normal probability distributions. Table 2 shows thatthe results obtained were normally distributed for all groups of solution.
|
One-Sample Kolmogorov-Smirnov Test |
|||||
|
Solution |
|||||
|
Coffee |
Tea |
Turmeric |
Sunset yellow |
||
|
Delta E |
Delta E |
Delta E |
Delta E |
||
|
N |
30 |
30 |
30 |
30 |
|
|
Normal Parameters (a, b) |
Mean |
2.3582 |
2.1587 |
19.6527 |
2.2143 |
|
Std. Deviation |
1.01784 |
.75496 |
1.90189 |
.84199 |
|
|
Most Extreme Differences |
Absolute |
.158 |
.129 |
.149 |
.117 |
|
Positive |
.158 |
.094 |
.149 |
.117 |
|
|
Negative |
-.079 |
-.129 |
-.090 |
-.082 |
|
|
Kolmogorov-Smirnov Z |
.865 |
.709 |
.814 |
.643 |
|
|
Asymp. Sig. (2-tailed) |
.443 |
.696 |
.521 |
.803 |
|
|
a Test distribution is Normal. |
|||||
|
b Calculated from data. |
|||||
2. Univariate analysis of variance: (Table 3)
Analysis of variance (ANOVA) was used to uncover the main and interaction effects of categorical independent variables (called "factors") on an interval dependent variable. In this study ANOVA test was used to determine the effect of duration of the study, solution and thickness (Independent variables) on the colour stability of valplast material (Dependant variable).
From this it was evident that the effect of the overall interaction of the duration of immersion of the samples, the solution used and thickness of the sample were statistically significant in determining the color stability of valplast material (p<0.01). From the paired interactions, it was observed that the interaction effect of DURATION AND SOLUTION was statistically significant (p<0.01) in producing color change. The interaction effect of DURATION AND THICKNESS was also statistically significant (p<0.01) in producing colour change. But the interaction effect of SOLUTION AND THICKNESS was not statistically significant (p>0.01). From the individual interactions it was observed that, the effect of DURATION, SOLUTION and THICKNESS was statistically significant in producing colour change (p<0.01).
Table 3-Univariate analysis of variance
|
Tests of Between-Subjects Effects |
|||||
|
Source |
Type III Sum of Squares |
Df |
Mean Square |
F |
Sig. |
|
Corrected Model |
6940.843(a) |
23 |
301.776 |
568.843 |
.000 |
|
Intercept |
5220.800 |
1 |
5220.800 |
9841.135 |
.000 |
DURATION |
17.026 |
2 |
8.513 |
16.047 |
.000 |
SOLUTION |
6819.741 |
3 |
2273.247 |
4285.039 |
.000 |
THICKNESS |
37.403 |
1 |
37.403 |
70.504 |
.000 |
DURATION * SOLUTION |
31.274 |
6 |
5.212 |
9.825 |
.000 |
DURATION * THICKNESS |
6.433 |
2 |
3.217 |
6.063 |
.003 |
SOLUTION * THICKNESS |
3.666 |
3 |
1.222 |
2.304 |
.082 |
DURATION * SOLUTION * THICKNESS |
25.299 |
6 |
4.217 |
7.948 |
.000 |
|
Error |
50.929 |
96 |
.531 |
||
|
Total |
12212.572 |
120 |
|||
|
Corrected Total |
6991.772 |
119 |
|||
|
a R Squared = .993 (Adjusted R Squared = .991) |
|||||
3. Post Hoc Test ( Table 4a and 4b )
Post Hoc test was used in conjunction with ANOVA to determine which specific group was statistically different from other group. In Post Hoc test for the duration of the study, the pairs 10 hrs and 30 hrs, 10 hrs and 60 hrs, 30 hrs and 60 hrs were compared. There was no statistically significant difference in color stability between Group X and Group Y (p>0.05), but there was statistically significant difference between Group X and Group Z (p<0.05) and Group Y and Group Z (p<0.05). The average ∆ E values of Group Z (6.1111) were lower than Group X (6.6473) and Group Y(7.0295). So it was inferred that the color difference at 60 hours duration was lower than that of the other durations.
In Post hoc test for the type of solution, four solutions (Coffee, Tea, Turmeric and Sunset Yellow) used in the study, the effect of each solution was compared with the other three solutions.From this test it is inferred that turmeric solution produced greater colour change than the other solutions(p<0.05).
Table 4 a: Post Hoc Study (Duration of the study)
|
Delta E |
|||
|
N |
Subset |
||
|
Duration of Study |
1 |
2 |
|
|
60 hrs |
40 |
6.1111 |
|
|
10 hrs |
40 |
6.6473 |
|
|
30 hrs |
40 |
7.0295 |
|
|
Sig. |
1.000 |
.069 |
|
Table 4 b: Post Hoc study (Type of solution)
|
Delta E |
|||
|
N |
Subset |
||
|
Solution |
1 |
2 |
|
|
Tea |
30 |
2.1587 |
|
|
Sunset yellow |
30 |
2.2143 |
|
|
Coffee |
30 |
2.3582 |
|
|
Turmeric |
30 |
- |
19.6527 |
|
Sig. |
.771 |
1.000 |
|
NBS Parameter
The NBS parameter is important to relate the amount of colour change (ΔE) recorded by the spectrophotometer to a clinical environment. The data obtained ΔE were converted to National Bureau of Standards units (NBS units) through the equation, NBS unitsï¼ΔE ×0.92.[7,8]The color change values of experimental valplast samples exposed to food colorants for 10 hrs, 30 hrs and 60 hrs duration according to National Bureau of Standards Unit system is shown in Table 5.
Table 5
|
Coffee |
Tea |
Turmeric |
Sunset yellow |
|||||
|
1mm |
2mm |
1mm |
2mm |
1 mm |
2 mm |
1mm |
2mm |
|
|
Group X |
1.43 |
2.75 |
1.36 |
2.17 |
19.62 |
17.63 |
1.19 |
2.77 |
|
Group Y |
2.01 |
3.0 |
1.78 |
2.82 |
17.90 |
20.27 |
1.42 |
2.52 |
|
Group Z |
1.06 |
2.76 |
1.21 |
2.56 |
15.96 |
17.09 |
1.69 |
2.64 |
Trace – 0.0 – 0.5 Slight – 0.5- 1.5 Noticeable – 1.5- 3.0 Exceeding noticeable range - > 3.0
DISCUSSION
In this study the dimension of the samples were determined to meet the requirements of the measuring instrument, spectrophotometer as done in a previous study 9 that tested polymethylmethacyrlate resin in three food colorants. The concentration of the solution used in this study was based on an average intake of coffee, tea, turmeric and sunset yellow per day. The average intake of coffee and tea were 500 mg twice or thrice per day. The concentration used was 1% for coffee and tea which was in accordance with the previous studies 10.
The maximal intake of sunset yellow in various food substances is 1 mg/kg body weight. The normal intake level of turmeric is 400- 600 mg twice or thrice per day.
The interactions of the factors influencing the color stability of valplast denture base material in this study were analysed. The effect of the overall interaction of the duration of immersion of the samples, the solution used and thickness of the sample were statistically significant in determining the color stability of valplast material. From the paired interactions, it was observed that the interaction effect of DURATION AND SOLUTION and DURATION AND THICKNESS was statistically significant in producing color change. But the interaction effect of SOLUTION AND THICKNESS was not statistically significant.
From the individual interactions it was observed that, the effect of DURATION was statistically significant in producing colour change. The average ∆ E values of Group Z were lower than Group X and Group Y which was in accordance with the previous studies as related to coffee and tea. Keskin11 evaluated the color stability of polymethyl methacrylate denture base polymers after immersion in coffee and tea solutions for 7 days and reported that there was an initial increase and then a decrease in the discolouration values of the materials. Imirzalioglu P et al12 studied the effect of tea, coffee and nicotine on the colour of different denture base acrylic resins after 1, 7 and 30 days.
A decrease in color difference values was observed for each type of material in tea and coffee solution especially after the 7th day. This was attributed to the removal of accumulated layers from the specimens once they reached a certain thickness and similar finding was seen in this study.
The effect of the type of SOLUTION was statistically significant in producing colour change.Turmeric solution produced significantly greater color change than all the other solutions tested. Stober T et al13 examined the color stability of seven resin based facing composites with a high content of inorganic filling material using ultraviolet radiation, sunset CPS+, tea, coffee, red wine and 0.1% turmeric solution and reported that red wine and turmeric solution resulted in severe discoloration (Δ E>10).Johnson and Kao14 stated that if ∆ E is less than 1, the chromatic alteration is slight, and between 1 and 2 is considered as clinically acceptable.
Goldstein and Schmitt15 reported that when ∆ E is more than 3.7, the colour change could be visually detected and becomes clinically unacceptable. Ruyter et al16 has reported ∆ E values higher than 3.3 to be clinically unacceptable. In this study turmeric solution produced the greatest colour change values with ∆ E greater than 3.7 in 10 hours, 30 hours and 60 hours duration in both 1-1.5 mm and 2-2.5mm thicknesses. This sample exhibited visual detectability and was therefore considered to be clinically unacceptable. All the other solutions except turmeric produced ∆ E values less than 3.7 and were considered to be in the clinically acceptable range.
The effect of THICKNESS was statistically significant in producing color change that suggested that the thickness of the material influenced the colour stability of valplast material. The average Δ E of the 1-1.5mm samples was 6.037667 and the average of the 2-2.5 mm samples was 7.15425. This indicates that the 1-1.5 mm samples were more color stable than the 2-2.5 mm samples in Group X, Group Y and Group Z except the turmeric subgroup that was clinically unacceptable in both 1 mm and 2 mm samples.
Denture base materials absorb liquid slowly over a period of time due to the polar properties of the resin molecules.GoiatoM C et al17 reported that Valplast presented a greater amount of reagents such as benzoyl peroxide. This reagent remains after polymerization and may influence the color stability of valplast material. Other factors responsible for color instability are, infiltration, surface roughness, chemical degradation by use, oxidation during double carbon reactions, continuous formation of pigments due to degradation of products, concentration of the staining solution and quality of stain, wettability of the material18.
Takayabashi Y et al19 reported that valplast materials exhibit less contact angle and are hydrophilic.The PolyAmidetype materials containauxochromes, and chromophores that are easily polarized. Staining can occur when the auxochromes combine with chromophores and free radicals in the staining solution.A common characteristic of beverages like wine, tea, and coffee is the presence of tanning agents, which have strong chromogenic potential. Tea flavins in tea leaves are reported to be the cause of discolouration. Caffeine and caffeic acid in coffee causes discolouration.
The staining potential of turmeric is due to the known high colorant nature and natural staining capacity of turmeric. The yellow color of turmeric is due to the active substance curcumin (4-5%)20. The sunset yellow dye is a water soluble azo dye which has charged and ionisable groups in their chemical structures9.The thermoplastic resins being hydrophilic are attracted to water soluble dyes on the surface and staining occurs as a result of electrostatic charges.
The present study is an invitro study where the interaction of saliva with the food colorants was not examined. The proteins and glycoproteins in saliva form pellicles that cause plaque accumulation which in turn can affect the colour stability. Further research is required to evaluate the colour stability in invivo situation
CONCLUSION
Within the limitations of the study, the following conclusions were drawn,
- The thickness of the sample, duration of immersion of the samples, the solution used, and their interactions were significant in producing colour change.
- The ∆ E values of Group Z (60 hrs duration) were lower than that of Groups X (10 hrs duration) and Group Y (30 hrs duration).
- The turmeric solution produced greater colour change than the other solutions (∆ E>3.7)
- According to the National Bureau of Standards, the 1-1.5 mm samples of Group X, Group Y and Group Z in all the subgroups were more color stable than the 2-2.5 mm samples except the turmeric subgroup, in which both 1-1.5 mm and 2-2.5 mm samples exceeded the noticeable range.
 |
| a. Colour difference (Δ E) of experimental valplastsamples(1 mm) for 10 hrs, 30 hrs and 60 hrs duration. b. Colour difference (Δ E) of experimental valplast samples (2mm) for 10 hrs, 30 hrs and 60 hrs duration. |
REFERENCES
- Chowdhary R, Nagalakshmi Chowdari. Need of implant dentistry in undergraduate curriculum in Indian dental colleges. Indian Journal of Dental Research 2011;22:436- 439.
- John J et al. Flexural strength of heat-polymerized polymethyl methacrylate denture resin reinforced with glass, aramid, or nylon fibers. J Prosthet Dent 2001;86:424-7.
- Anusavice K J, Philips science of dental materials, Eleventh edition, 143-166, Elsevier Inc, 2008.
- Crispin B J et al Colour stability of temporary restorative materials J Prosthet Dent 1979; 42:27-33.
- Navarro WFS et al Color Stability of Resins and Nylon as Denture Base Material in Beverages Journal of Prosthodontics 2011;20:632-638.
- Daniela M et al Color stability, surface roughness, surface porosity of acrylic reins for eye sclera polymerized by different heat sources Journal of Prosthodontics 2010;19:52-57.
- Lai Y et al In vitro color stability, stain resistance, and water sorption of four removable gingival flange materials J Prosthet Dent 2003;90:293-300.
- Koksal T et al Colour stability of different denture teeth materials against various staining agents Dental materials journal 2008;27:139-144.
- Hersek N et al. Colour stability of denture base acrylic resins in three food colorants. J Prosthet Dent 1999;81:375-9.
- Ilmaz B et al Colour stability of denture base polymers Int J Proshtodont 1994;7:372-382.
References are available on request
Disclaimer from Guident
The views and opinions expressed in articles published in Guident are solely those of the authors and do not necessarily reflect the views of the editors, the editorial board or the publisher, Ivory India. Guident does not endorse any product, technique or treatment described. Clinical content is intended for qualified dental and medical professionals and is not a substitute for individual clinical judgement. Guident, its editors and the publisher accept no liability for any consequence arising from the use of information published in the journal.
How to cite this article
Dr. Janani Rajarajan, Dr Anjana Kurien, Dr V.R. Thirumurthy Department of Prosthodontics. Evaluation of Color Stability of Flexible Denture Base Resin in Four Commonly Used Food Solutions. Guident. 2016 Apr;9(5). Available from: https://guident.in/articles/research/evaluation-of-color-stability-of-flexible-denture-base-resin-in-four-commonly-used-food-solutions.html